Kira Vision — Methodology Deep-Dive
We turned a $5k consumer drone into a bankable, IEC-compliant thermography platform.
The secret isn't hardware — it's where the photos land.
The Industry Problem
Every major player — Raptor Maps included — uses generic boustrophedon grid sweeps. The drone photographs the plant from random, inconsistent angles relative to module tilt.
Variable viewing angles create specular reflections from sky and sun, corrupting radiometric readings at the sensor level.
Thermal orthomosaics blend and blur raw radiometric pixels. The temperature you read is an interpolation artifact, not a measurement.
Reflections + stitching = phantom hotspots. O&M teams waste hours chasing anomalies that don't exist in the real data.
The RTK Solution
Flight plans generated from geospatial data: DSM-normalized altitude hold, string-aligned waypoints with RTK-fix precision. The drone follows the exact geometric line of each module row.
Gimbal pitch is controlled to align with module tilt or maintain safe nadir (−90°). Every frame captures the panel's emitted radiation — not sky reflections. Repeatability across campaigns is guaranteed by geometry, not operator skill.
No wasted photos. No idle hover. The camera fires only where modules exist. Optimized path routing (exact TSP for ≤16 rows) deposits overlap precisely on the target area — not on corridors and empty terrain.
Interactive Proof
Both scenarios below use identical capture parameters: 2 m/s, 1 photo every 2s, 80% frontal overlap, same footprint. The only difference is where the photo shadows accumulate.
Capture passes anchored to module rows; transitions happen off-target.
Boustrophedon sweep of the plant envelope with the same capture model.
Calculating consolidated comparison…
Analysis Pipeline
The industry's biggest mistake: measuring temperatures on stitched orthomosaics. We do the opposite — the ortho is an index, the raw photo is the evidence.
Global position reference. As-built extraction. Spatial inventory of every module with GPS coordinates and unique ID.
The original aerial photo at full resolution. Each cell individually resolved. Sub-pixel module segmentation via trained YOLO models.
Unaltered radiometric data. No stitching blur. Pure GSD at 2.3 cm/px (M3T @ 17 m, IFOV 1.33 mrad). The thermal audit and temperature extraction happen here — on the original, unmodified sensor output.
Visual Evidence
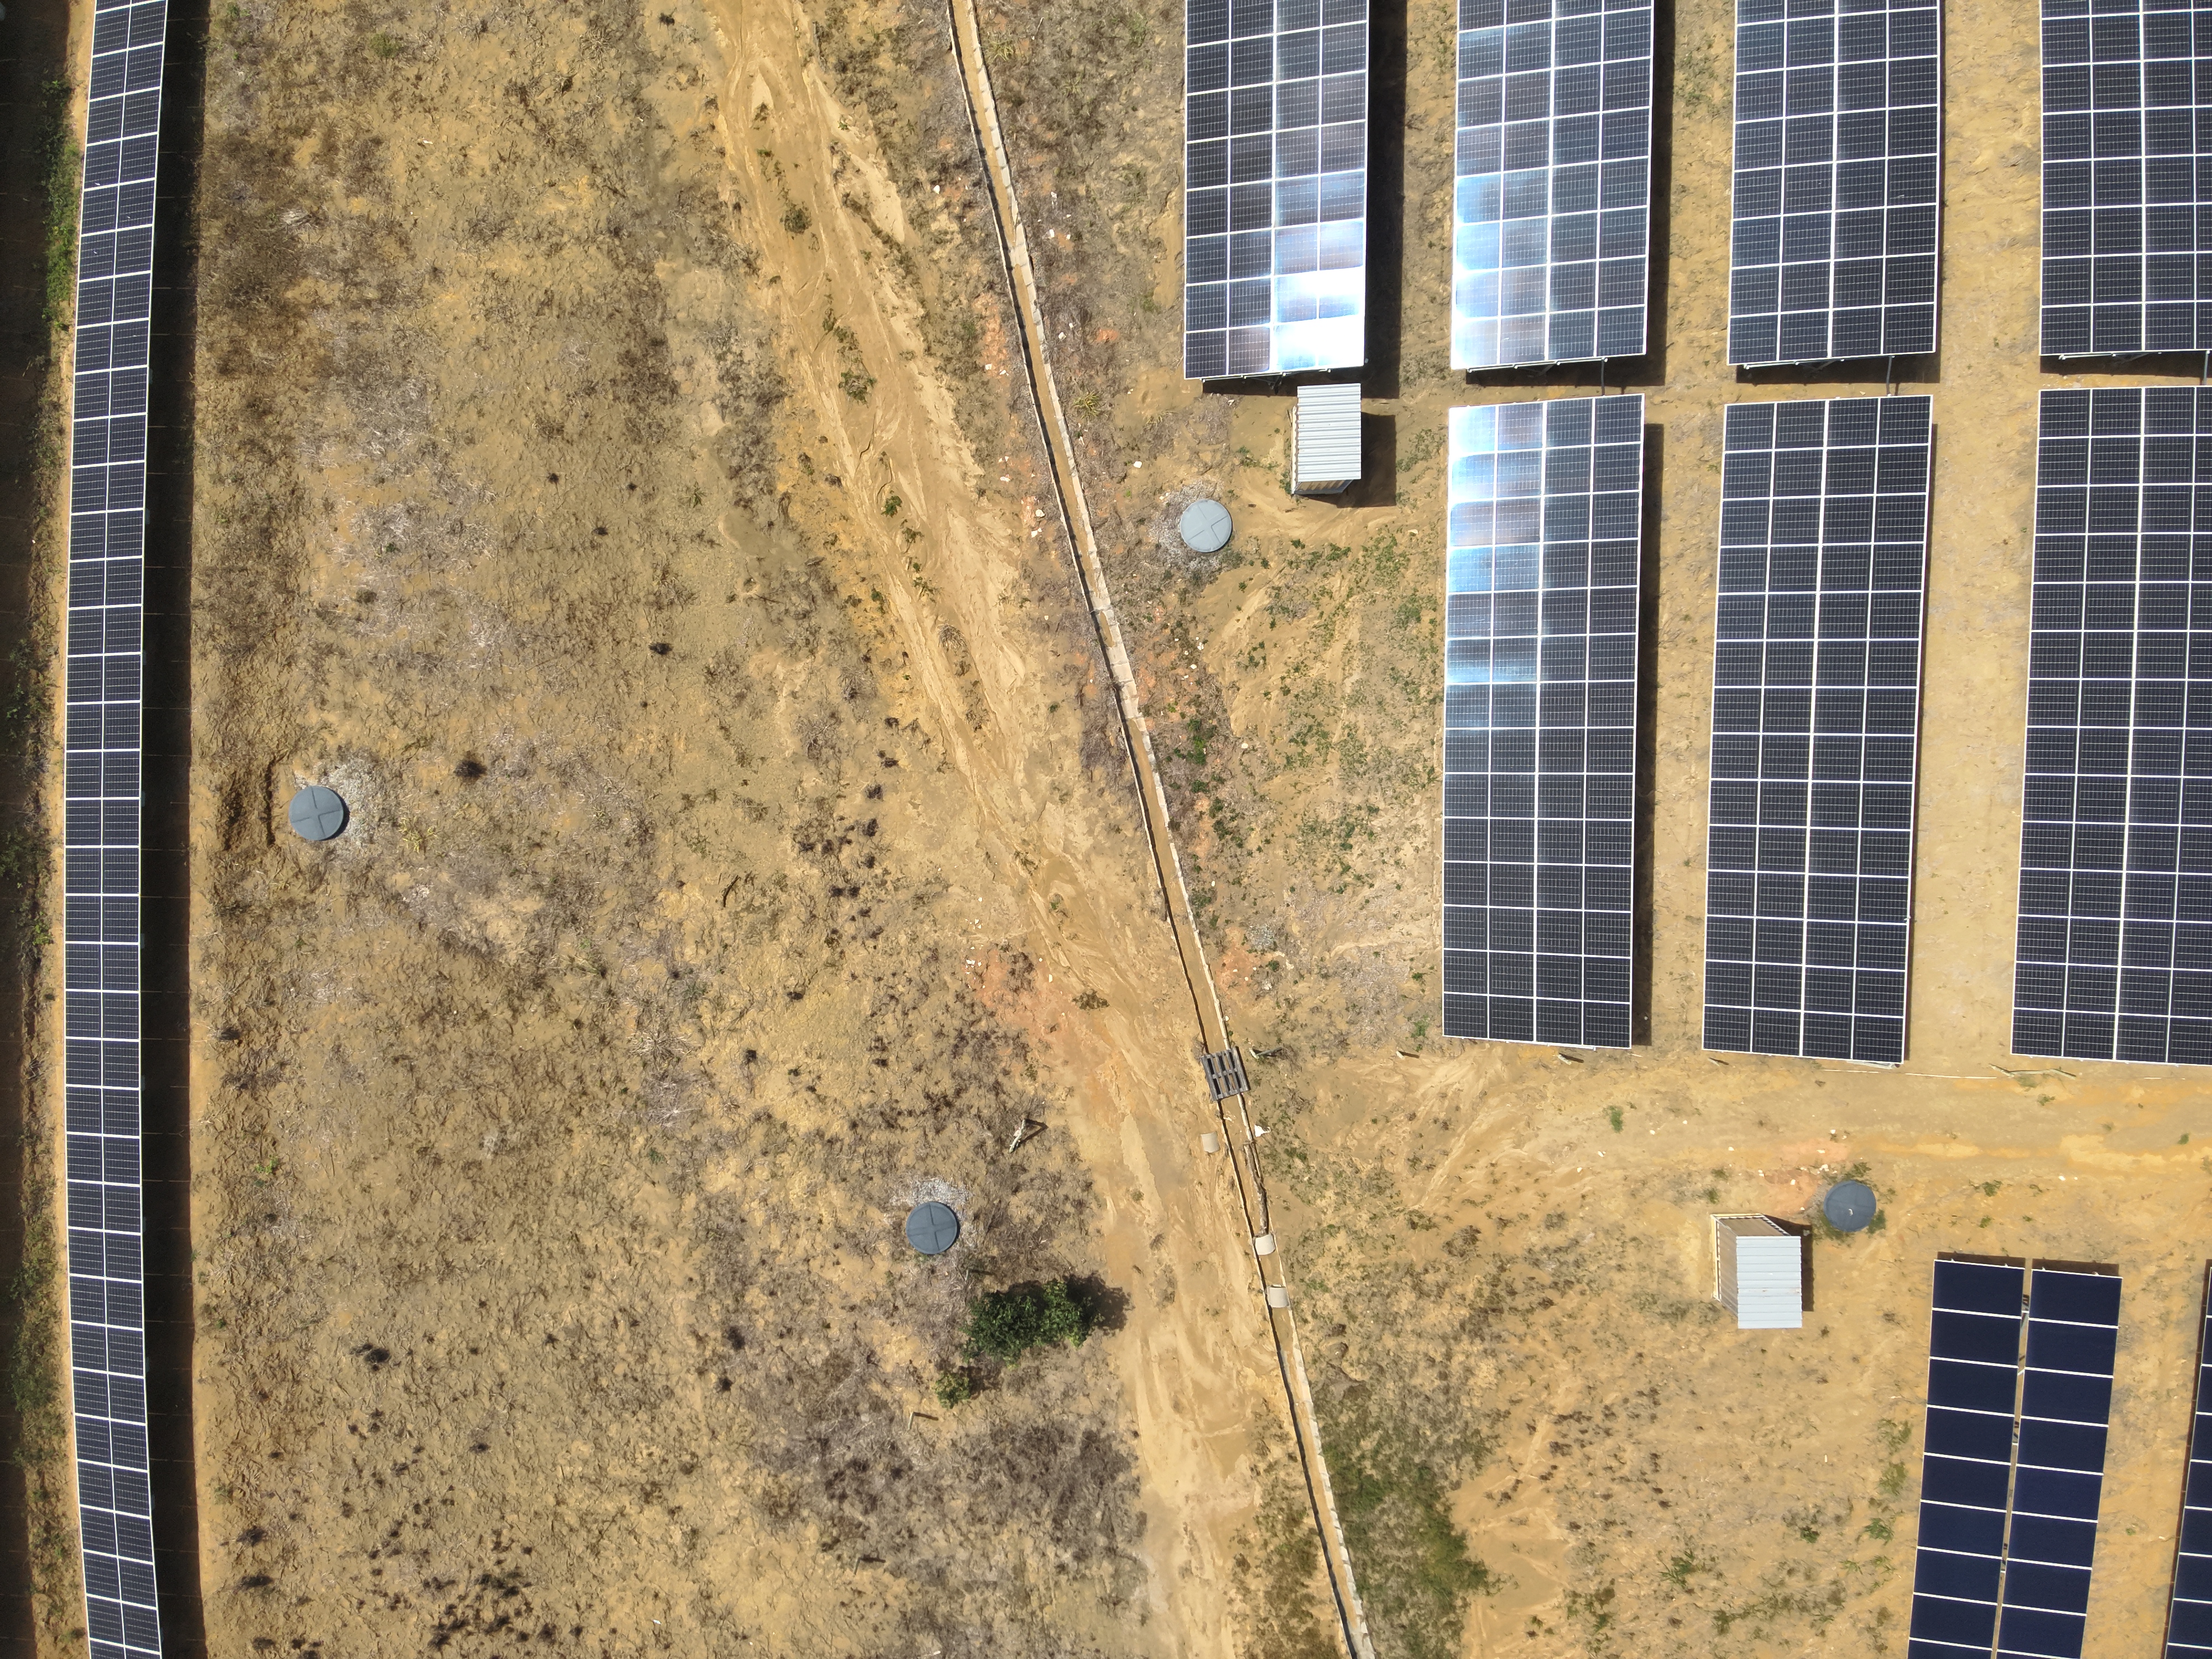
RGB — High altitude, misaligned
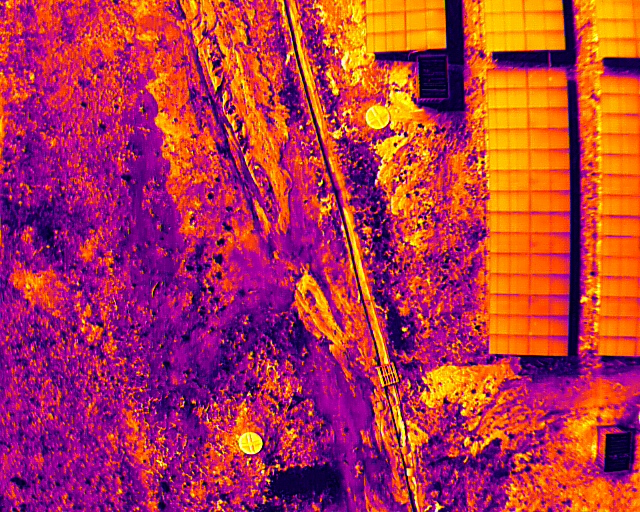
Thermal — Mostly empty terrain
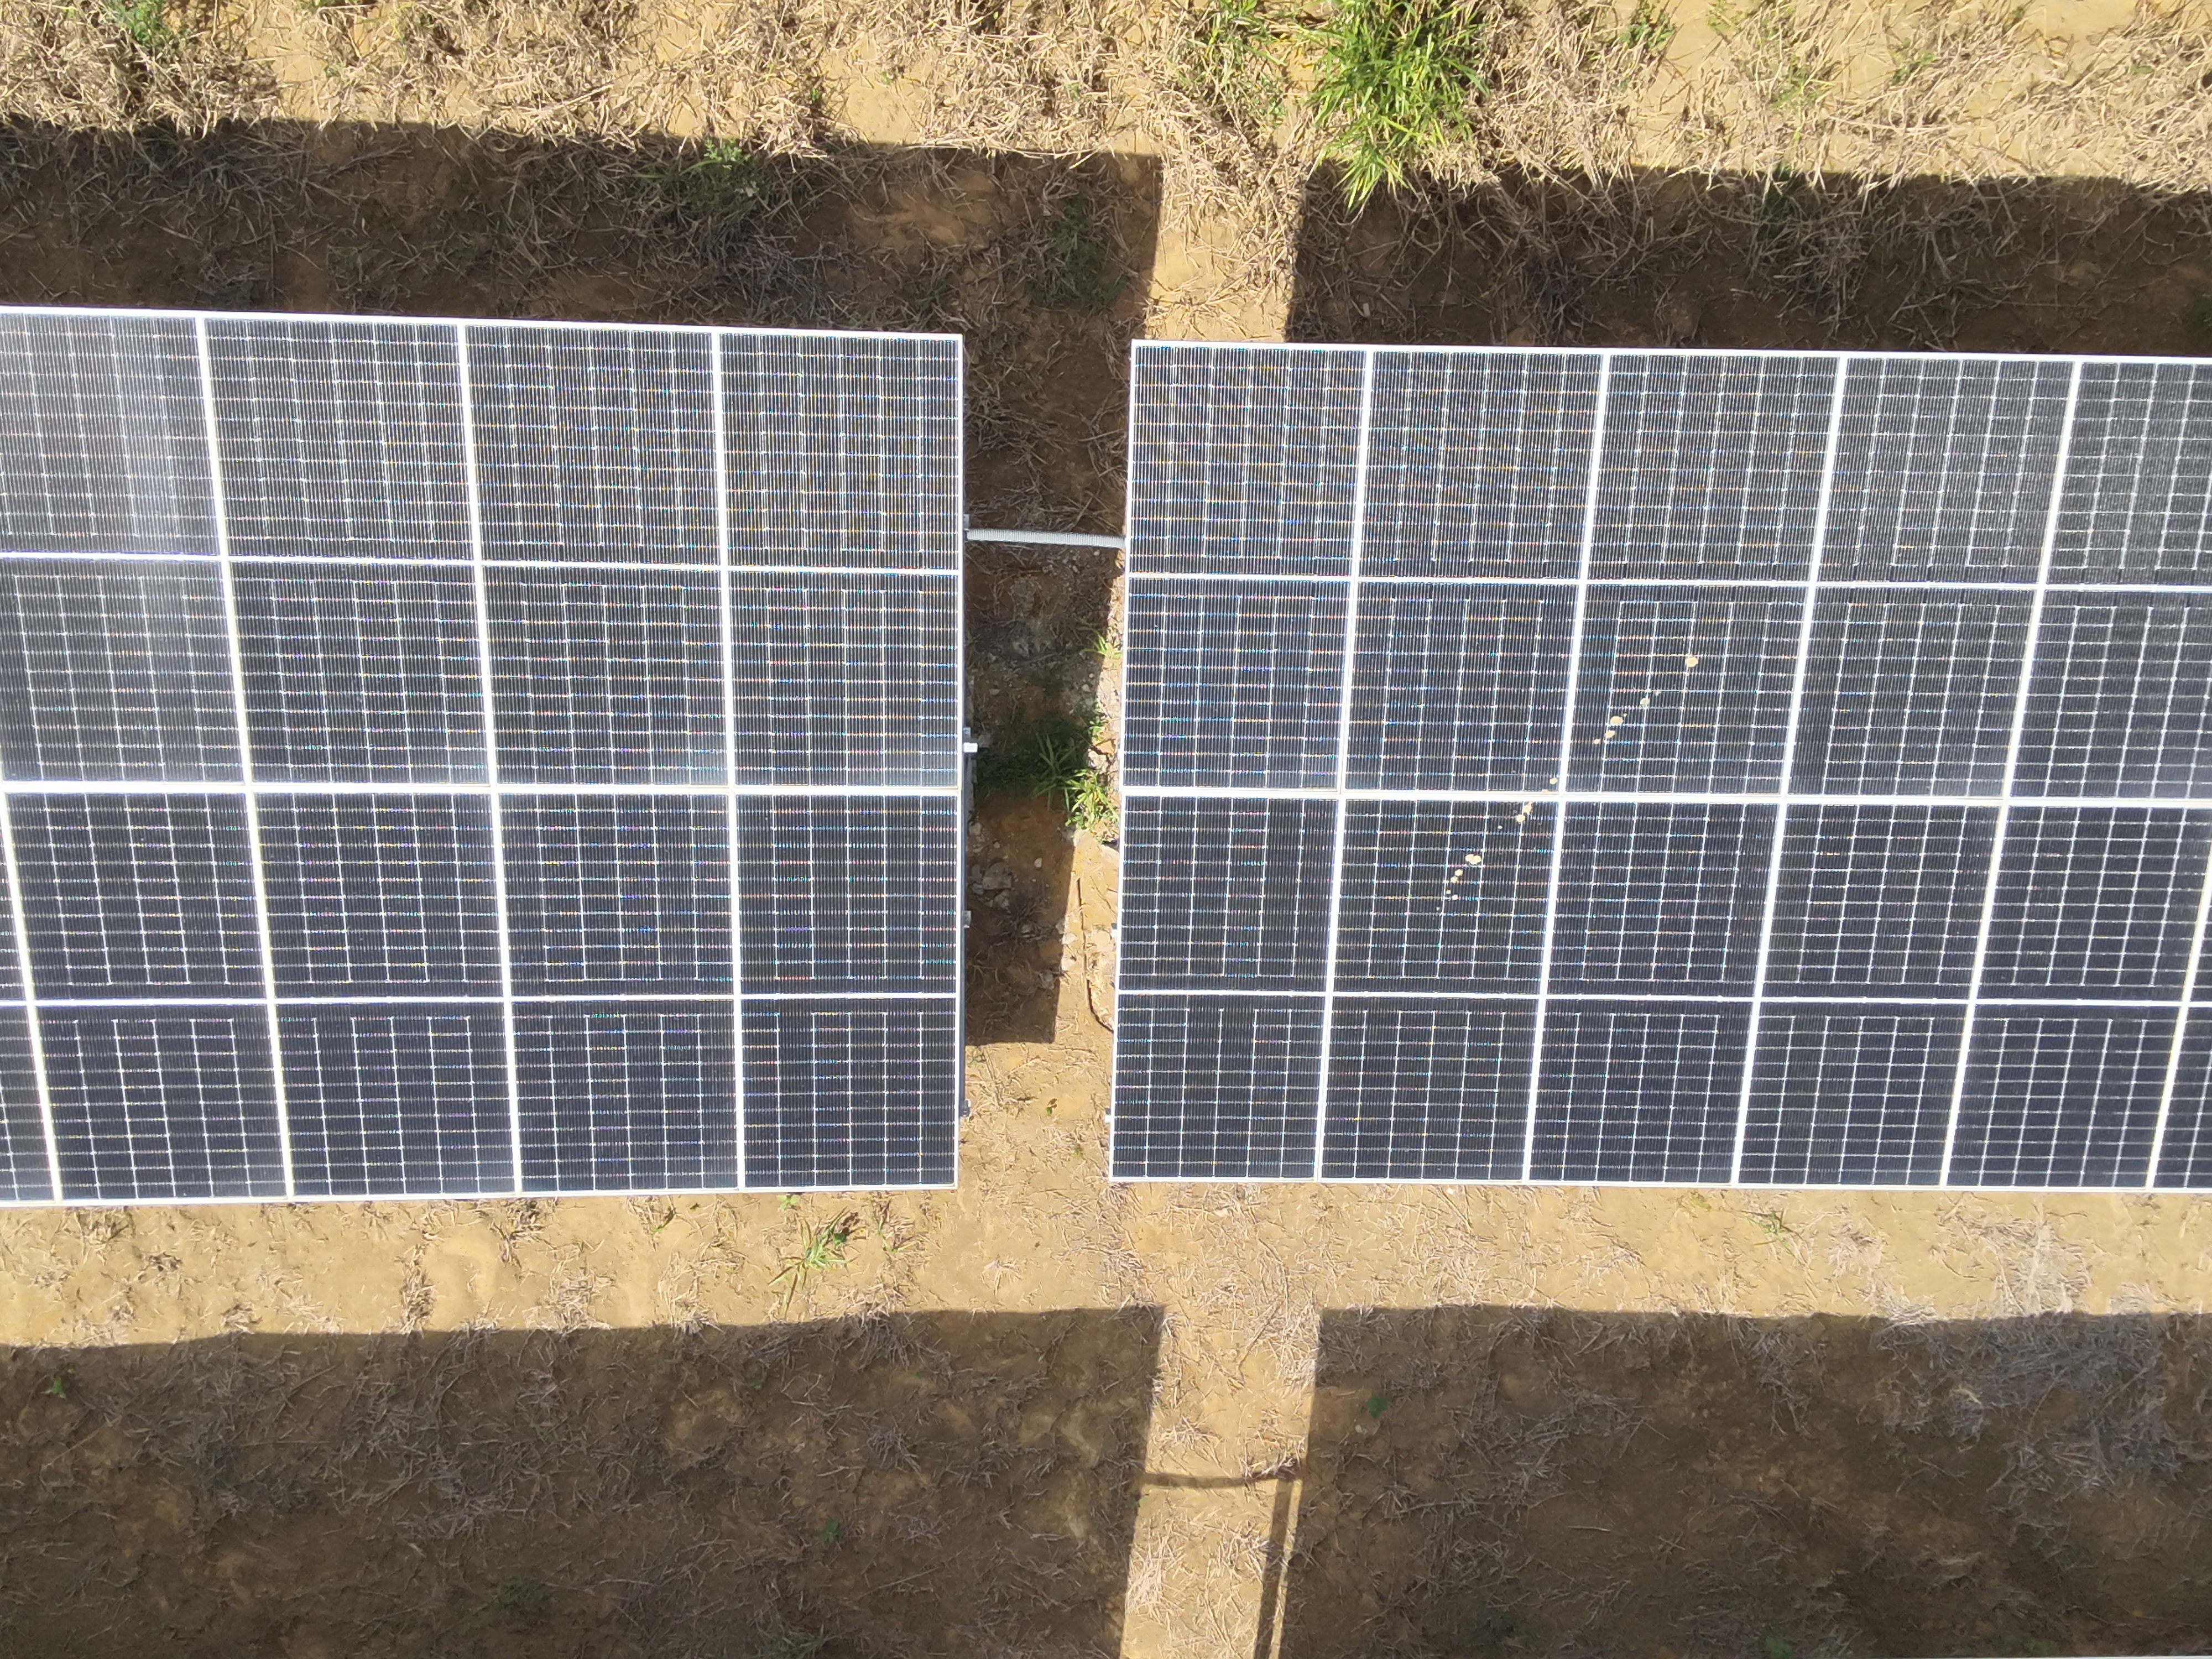
RGB — Every cell individually resolved
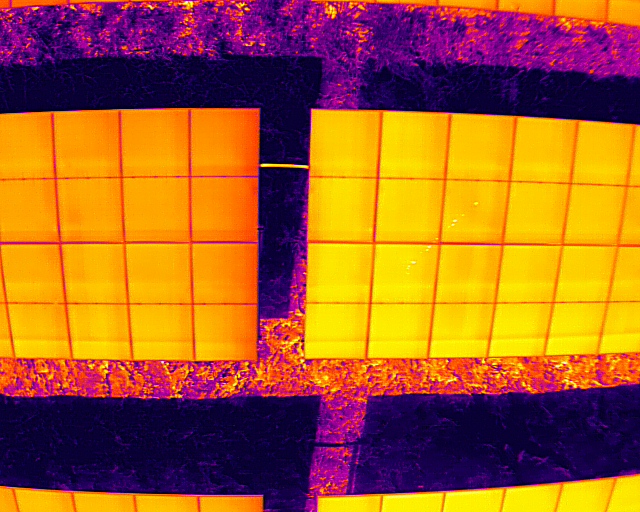
Thermal — Hotspot clearly measurable
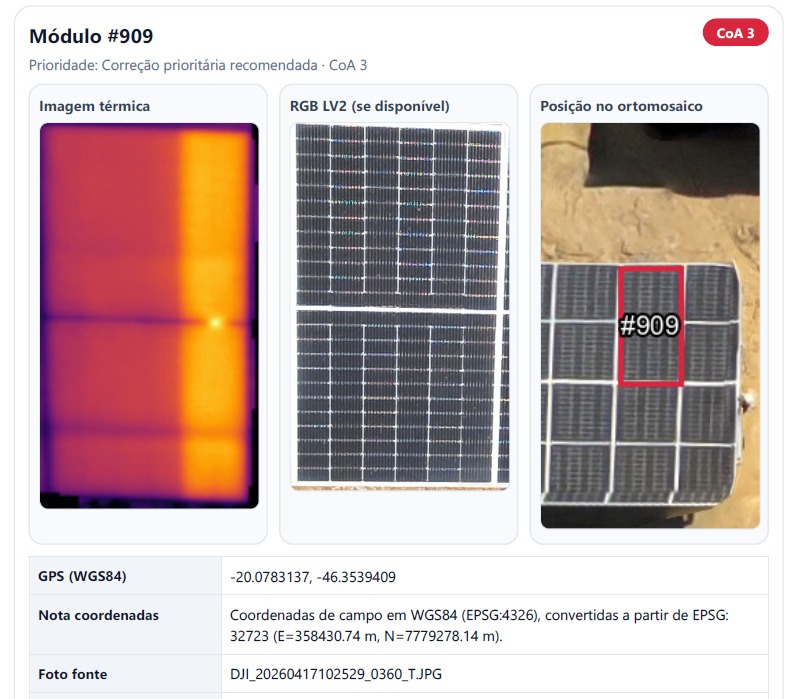
Module #909 — Thermal anomaly (left), high-res RGB crop (center), orthomosaic position with bounding box and GPS (right). Everything linked. Everything traceable. CoA 3 classification.
User Experience
The final deliverable is an interactive web report. The user clicks any module on the orthomosaic and instantly sees the original, unstitched RGB and thermal photos — not a blurry ortho pixel.
Open the plant orthomosaic — full overview
Click any module on the map
See the real RGB photo — each cell sharp and clear
See the real thermal photo — pure radiometric data
GPS coordinates, source photo ID, ΔT, CoA classification
Without centimeter-level georeferencing (RTK fix), you cannot project a module from the orthomosaic back to the raw photo with confidence. Without inter-sensor affine calibration, you cannot link the RGB pixel to the thermal pixel. The traditional orthomosaic is a dead end: beautiful to look at, but impossible to trace back to ground truth. Kira reverses the path: the ortho is the index, the raw photo is the evidence.
Hardware Disruption
| Specification | Enterprise (M300 + H20T) | Mavic 3T + Kira |
|---|---|---|
| Platform cost | ~$25,000 | ~$5,000 |
| Weight | 9 kg (special license) | 920 g |
| Thermal sensor | 640 × 512 | 640 × 512 (identical resolution) |
| IFOV | 0.89 mrad | 1.33 mrad |
| Max IEC altitude (≤3 cm/px) | 33.7 m | 22.5 m |
| Kira flight altitude | — | 17 m (safety margin) |
| GSD at Kira altitude (17 m) | 1.5 cm/px | 2.3 cm/px |
| GSD margin vs IEC limit | — | 24% below 3 cm/px |
| Analysis source | Stitched orthomosaic | Raw photo (unaltered) |
| IEC compliance | Depends on operator | Built into pipeline |
The H20T has a 1.5× better IFOV (0.89 vs 1.33 mrad), allowing it to fly at 33.7 m and still meet IEC's 3 cm/px limit. The M3T needs to fly at ≤22.5 m for the same GSD. But IFOV is a sensor property — it doesn't fix flight methodology. Most M300+H20T operators fly at 40-50 m (GSD 3.6-4.4 cm/px), exceeding IEC limits. With Kira's pipeline, the M3T at 17 m achieves 2.3 cm/px with a 24% safety margin — better than most H20T deployments in practice.
Summary
| Aspect | Industry / Raptor Maps | Kira Vision |
|---|---|---|
| Flight alignment | Generic grid (boustrophedon) | String-aligned (RTK) |
| Viewing angle | Variable, with reflections | Constant, gimbal-controlled |
| Thermal GSD | ~5 cm/px (M3T @ 38 m typical) | 2.3 cm/px (M3T @ 17 m) |
| IFOV utilization | Wasted — flies above IEC envelope | Optimized — 24% margin below 3 cm/px |
| Analysis source | Stitched orthomosaic | Original raw photo |
| Traceability | Module on map, no photo link | Module → RGB → Thermal |
| Flight efficiency | Photos wasted on empty terrain | Every photo on target |
| IEC compliance | Partial (GSD > 3 cm/px at typical altitude) | Full (17 m, GSD 2.3 cm/px, ≥75% overlap) |
| False positives | Frequent (reflections, stitching) | Minimized (raw data, constant angle) |